I hope that you enjoyed my review of Evolution’s Q4 2023 quarterly results. In this annual review, I will go through a few of the company’s multi-year trends.
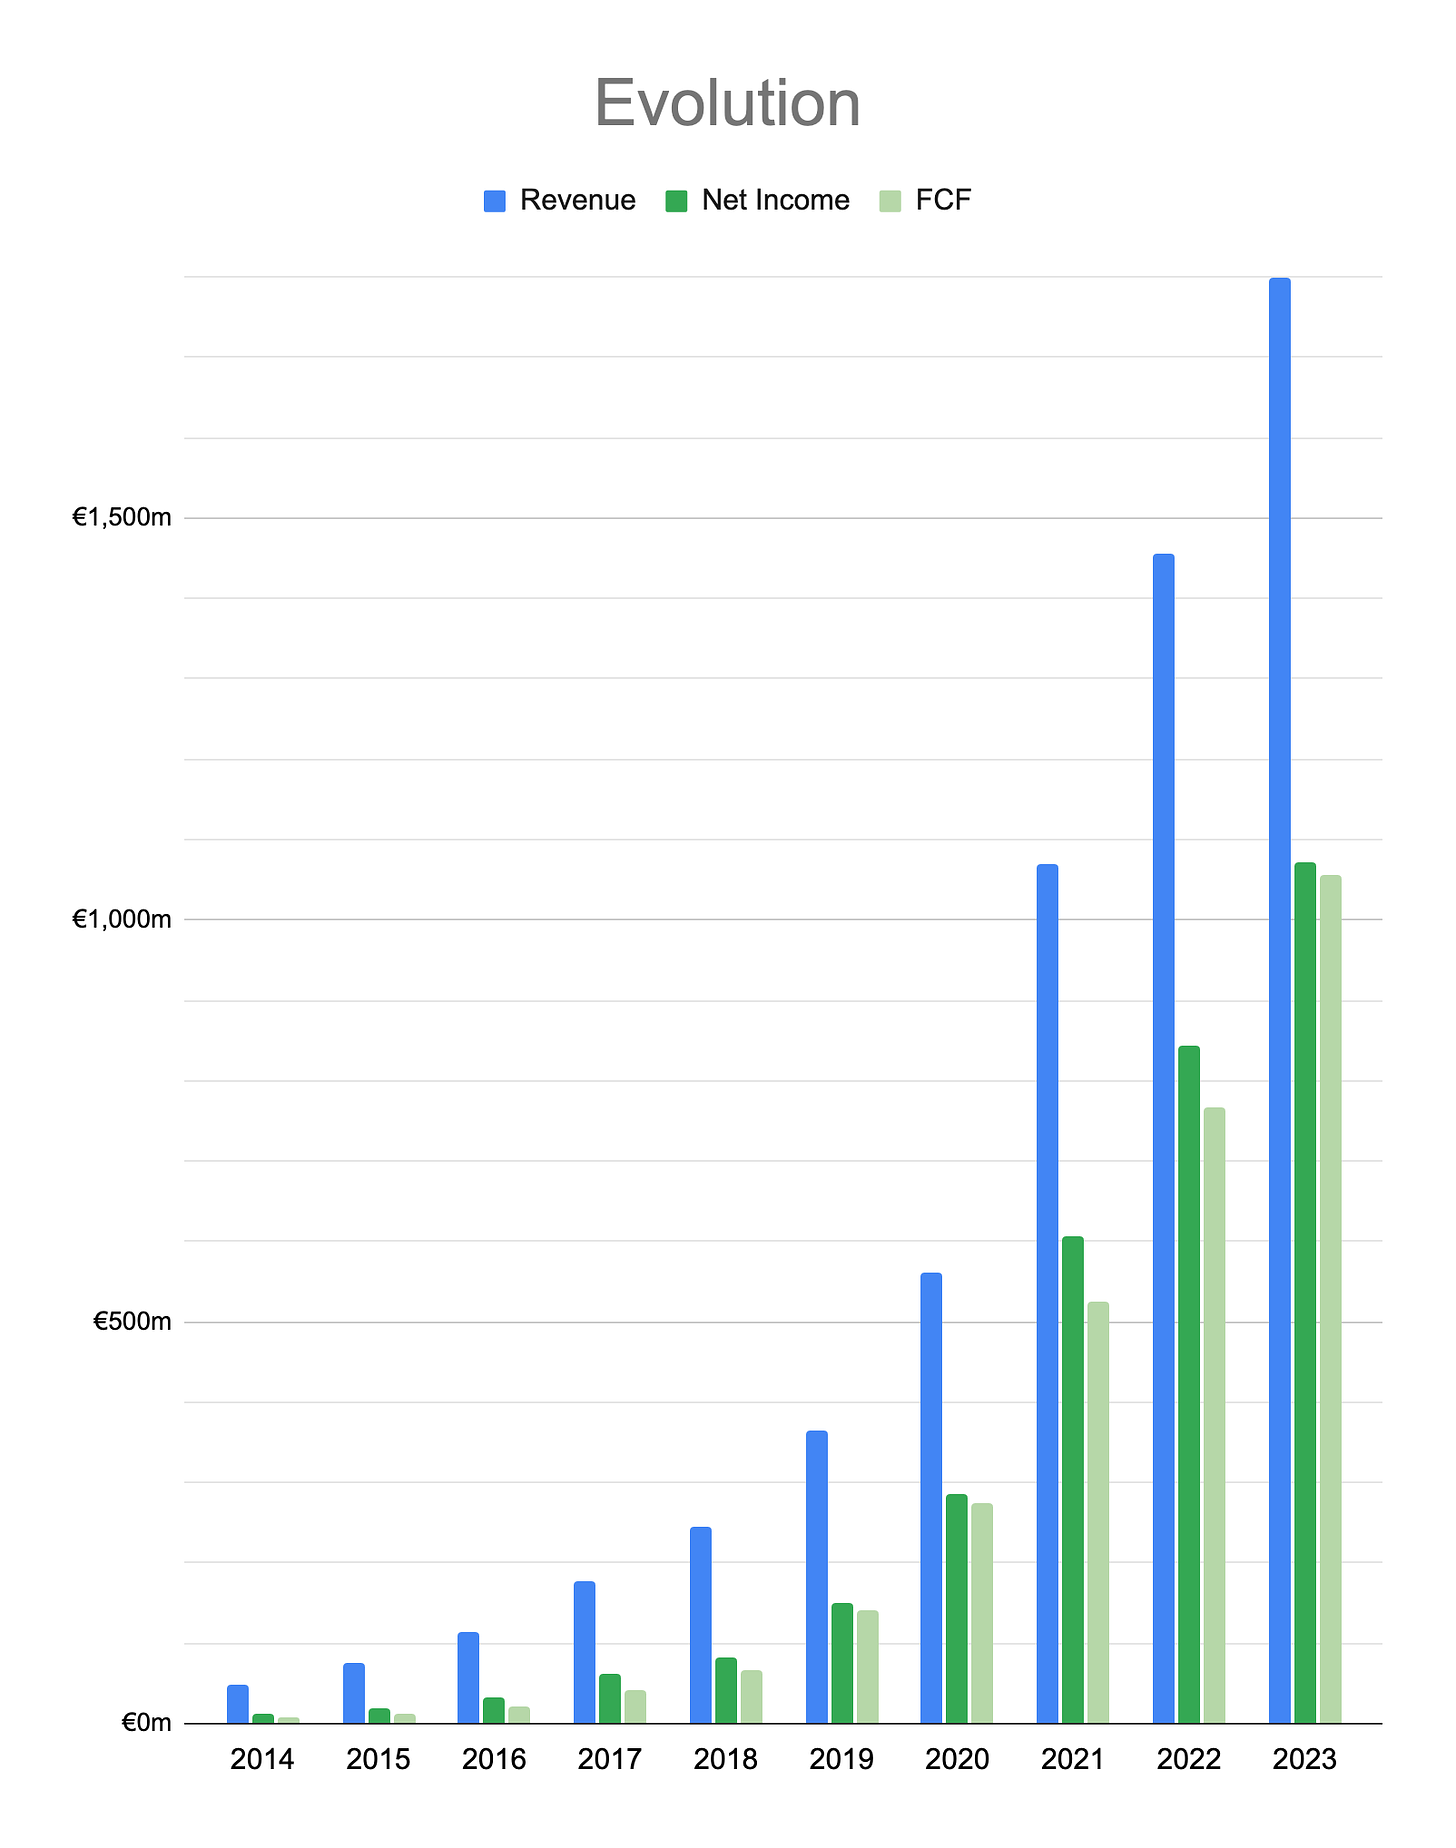
For the company’s long-term owners, the following two charts display the essence of their bull thesis so far.
In just the last five years, Evolution grew its sales by 7x, net income by 13x and free cash flow by 16x!
At the same time, company’s stock-based acquisitions (and their so far disappointing results) meant that per-share metrics grew somewhat slower with EPS at 11x and FCF/s at 13x in the same time frame.
Growth
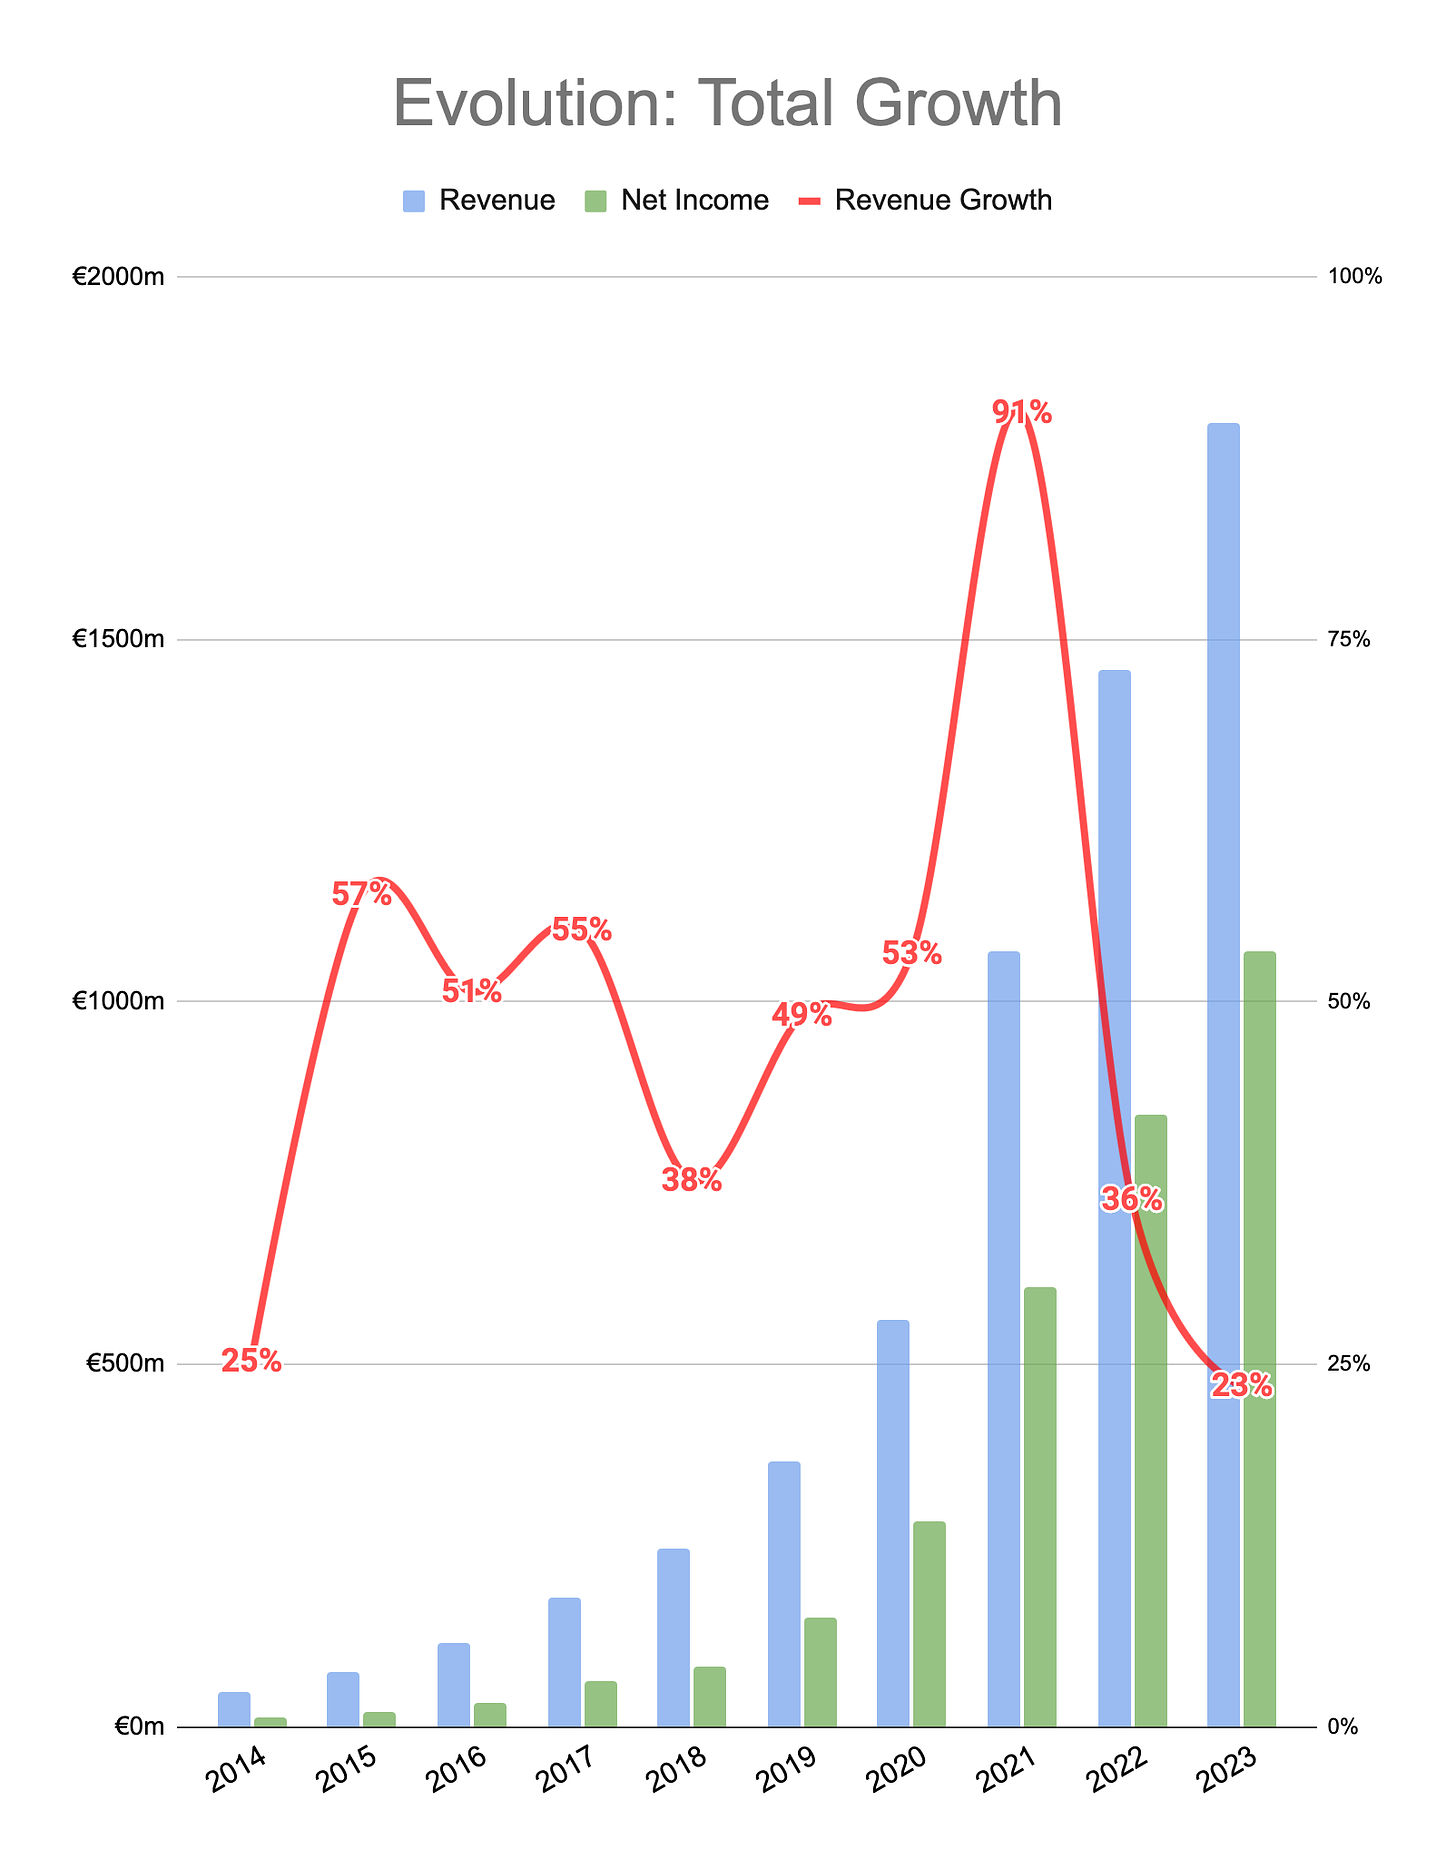
At first glance, Evolution’s growth rate seems to have declined to nearly a quarter of its peak two years ago.
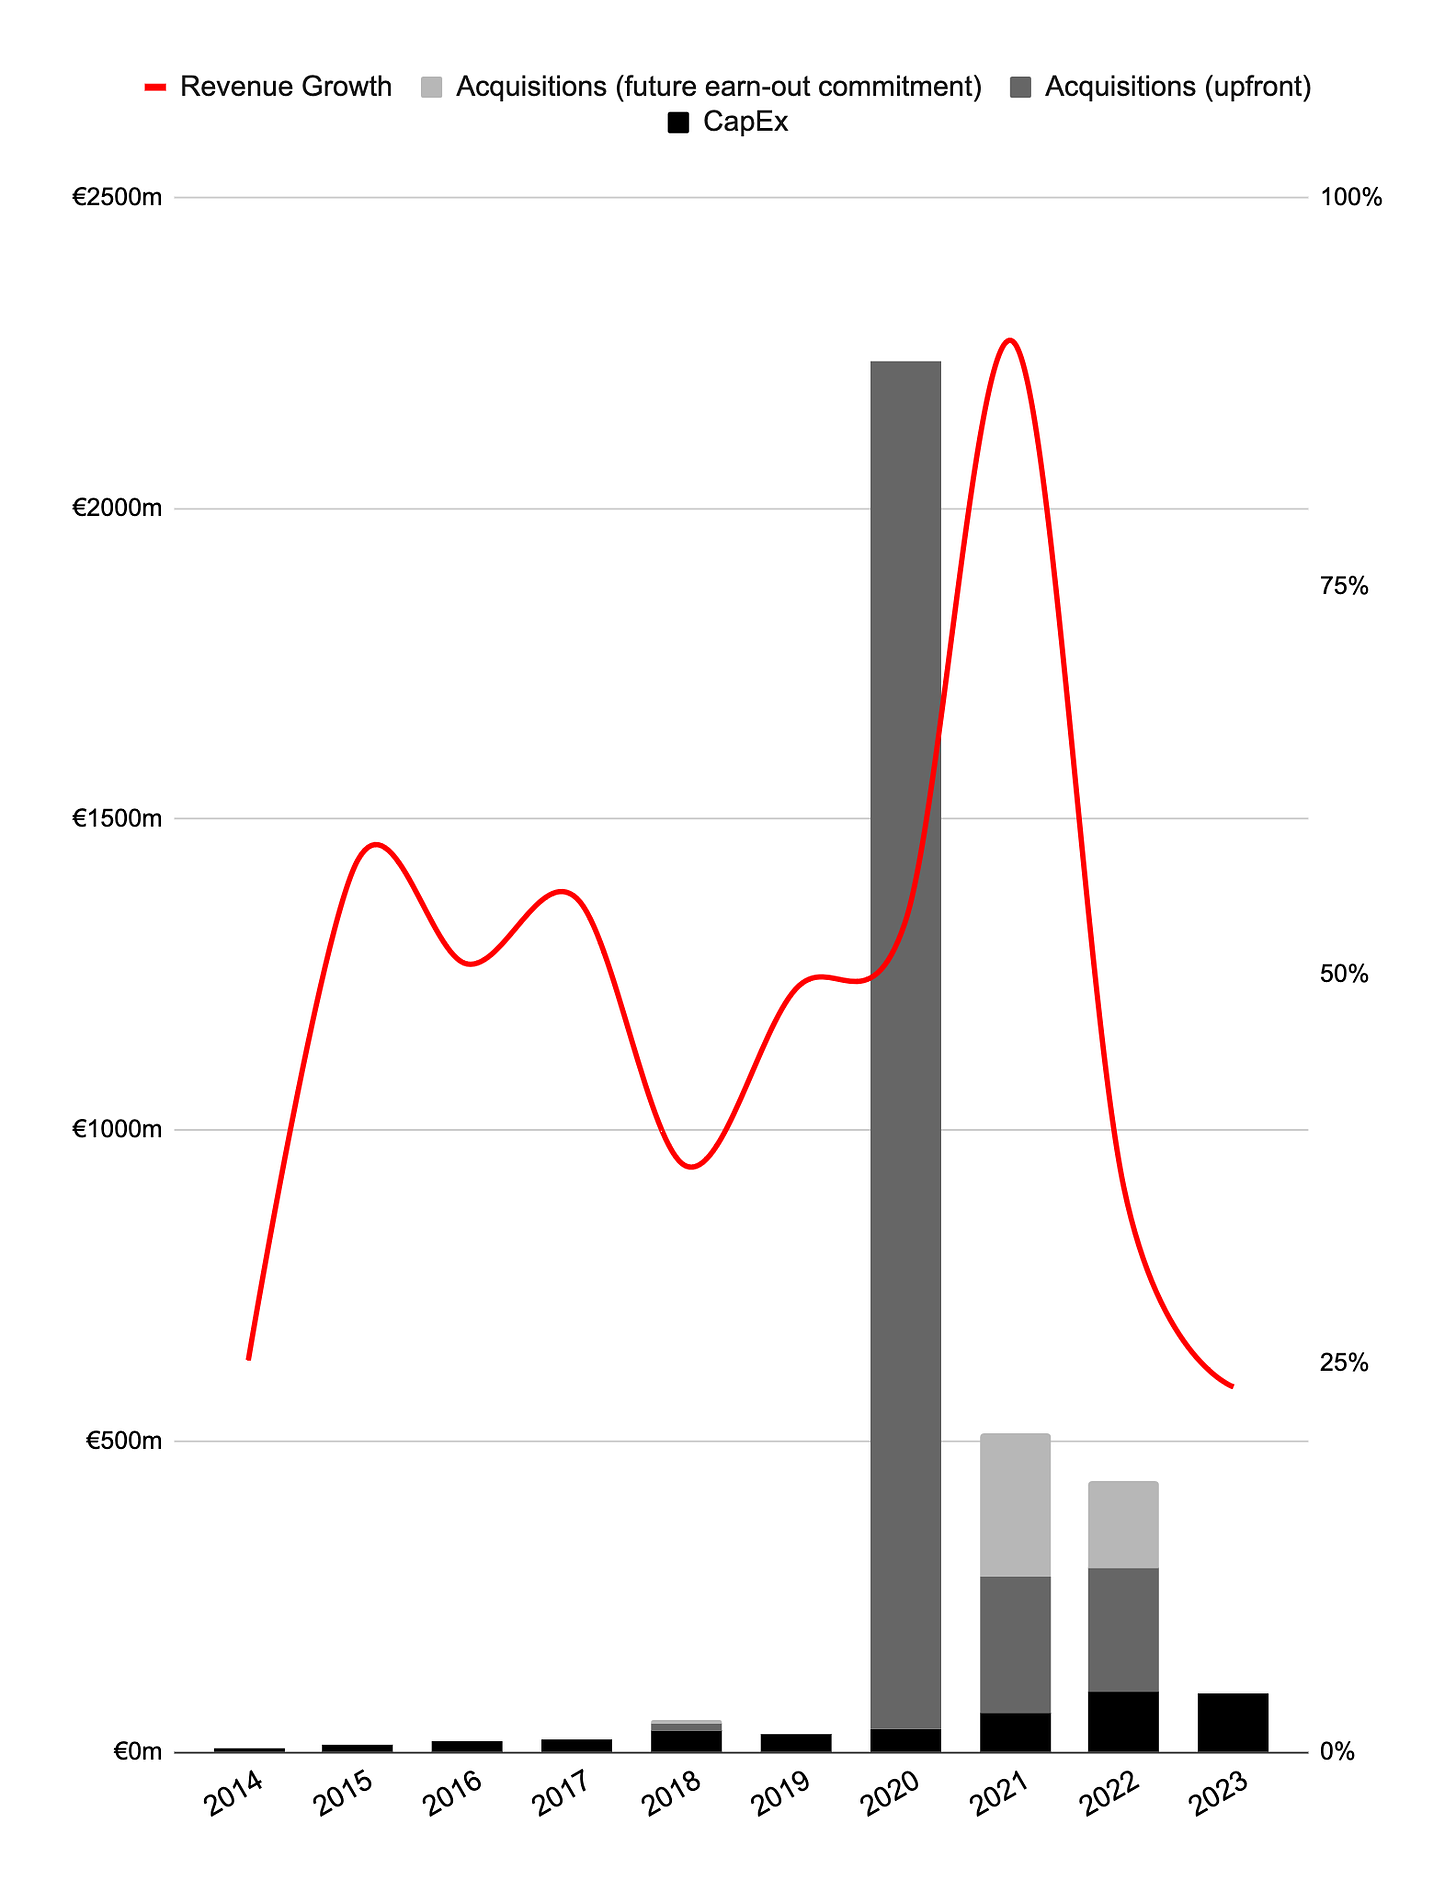
However, the growth rates in 2021 and 2022 include large amounts of inorganic growth from Evolution’s RNG acquisitions of nearly 3 billion Euros.
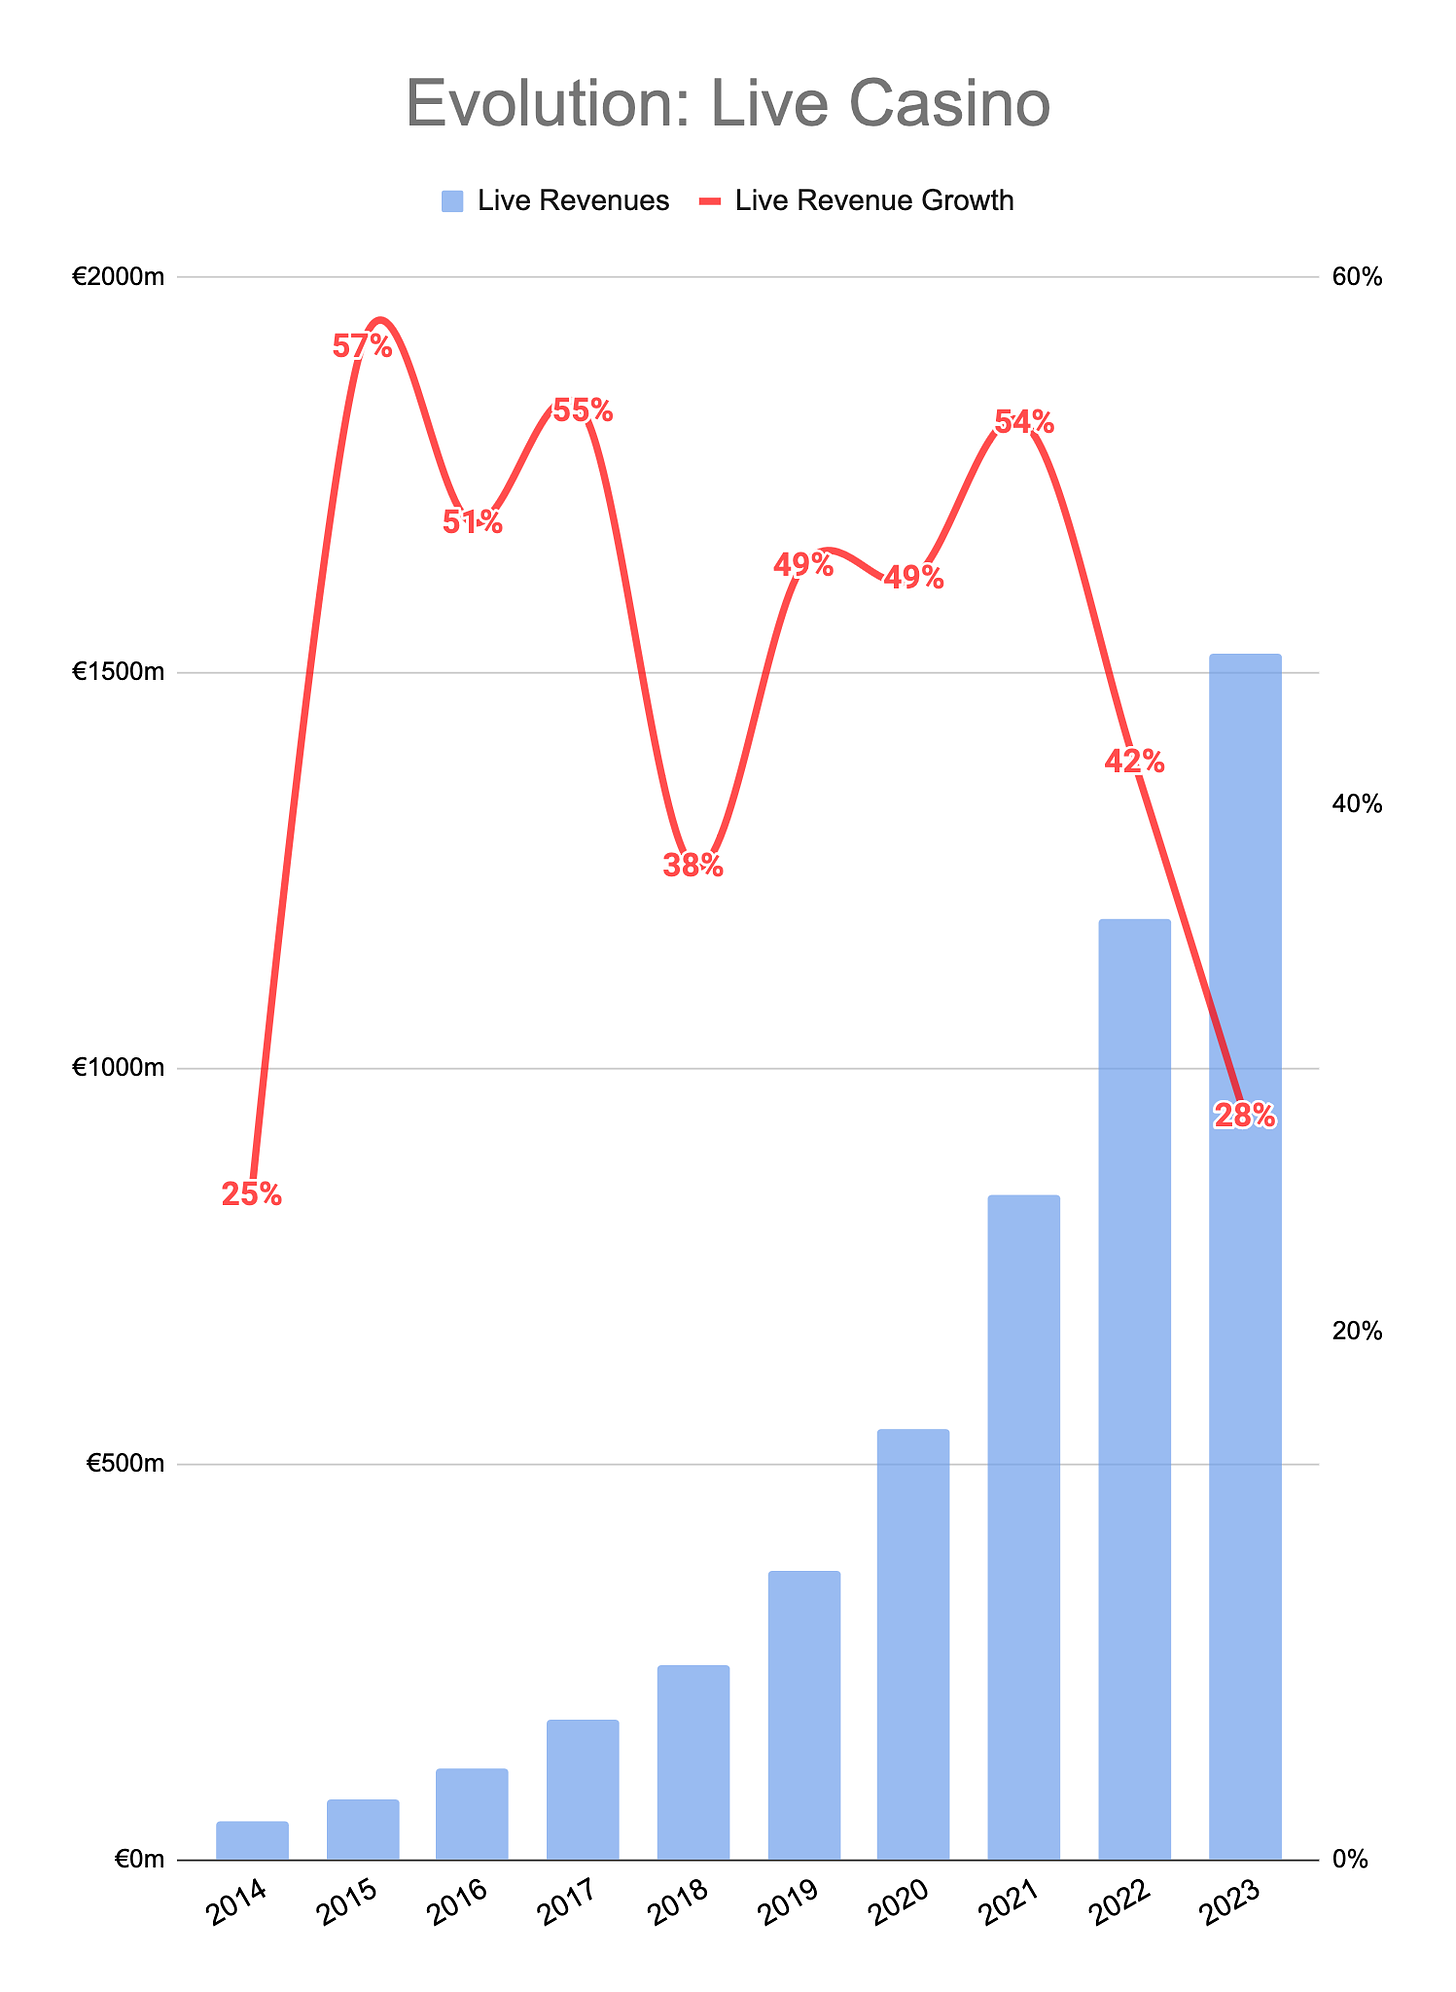
We should look at Live Casino revenues to get a better sense of the organic growth.
In organic terms, Evolution’s growth in 2023 has nearly halved from its previous peaks. As mentioned in my quarterly review, Evolution’s incremental growth seems stuck in a bounded range. As nominal growth stays near constant, the growth rate inevitably declines against the expanding sales pool.
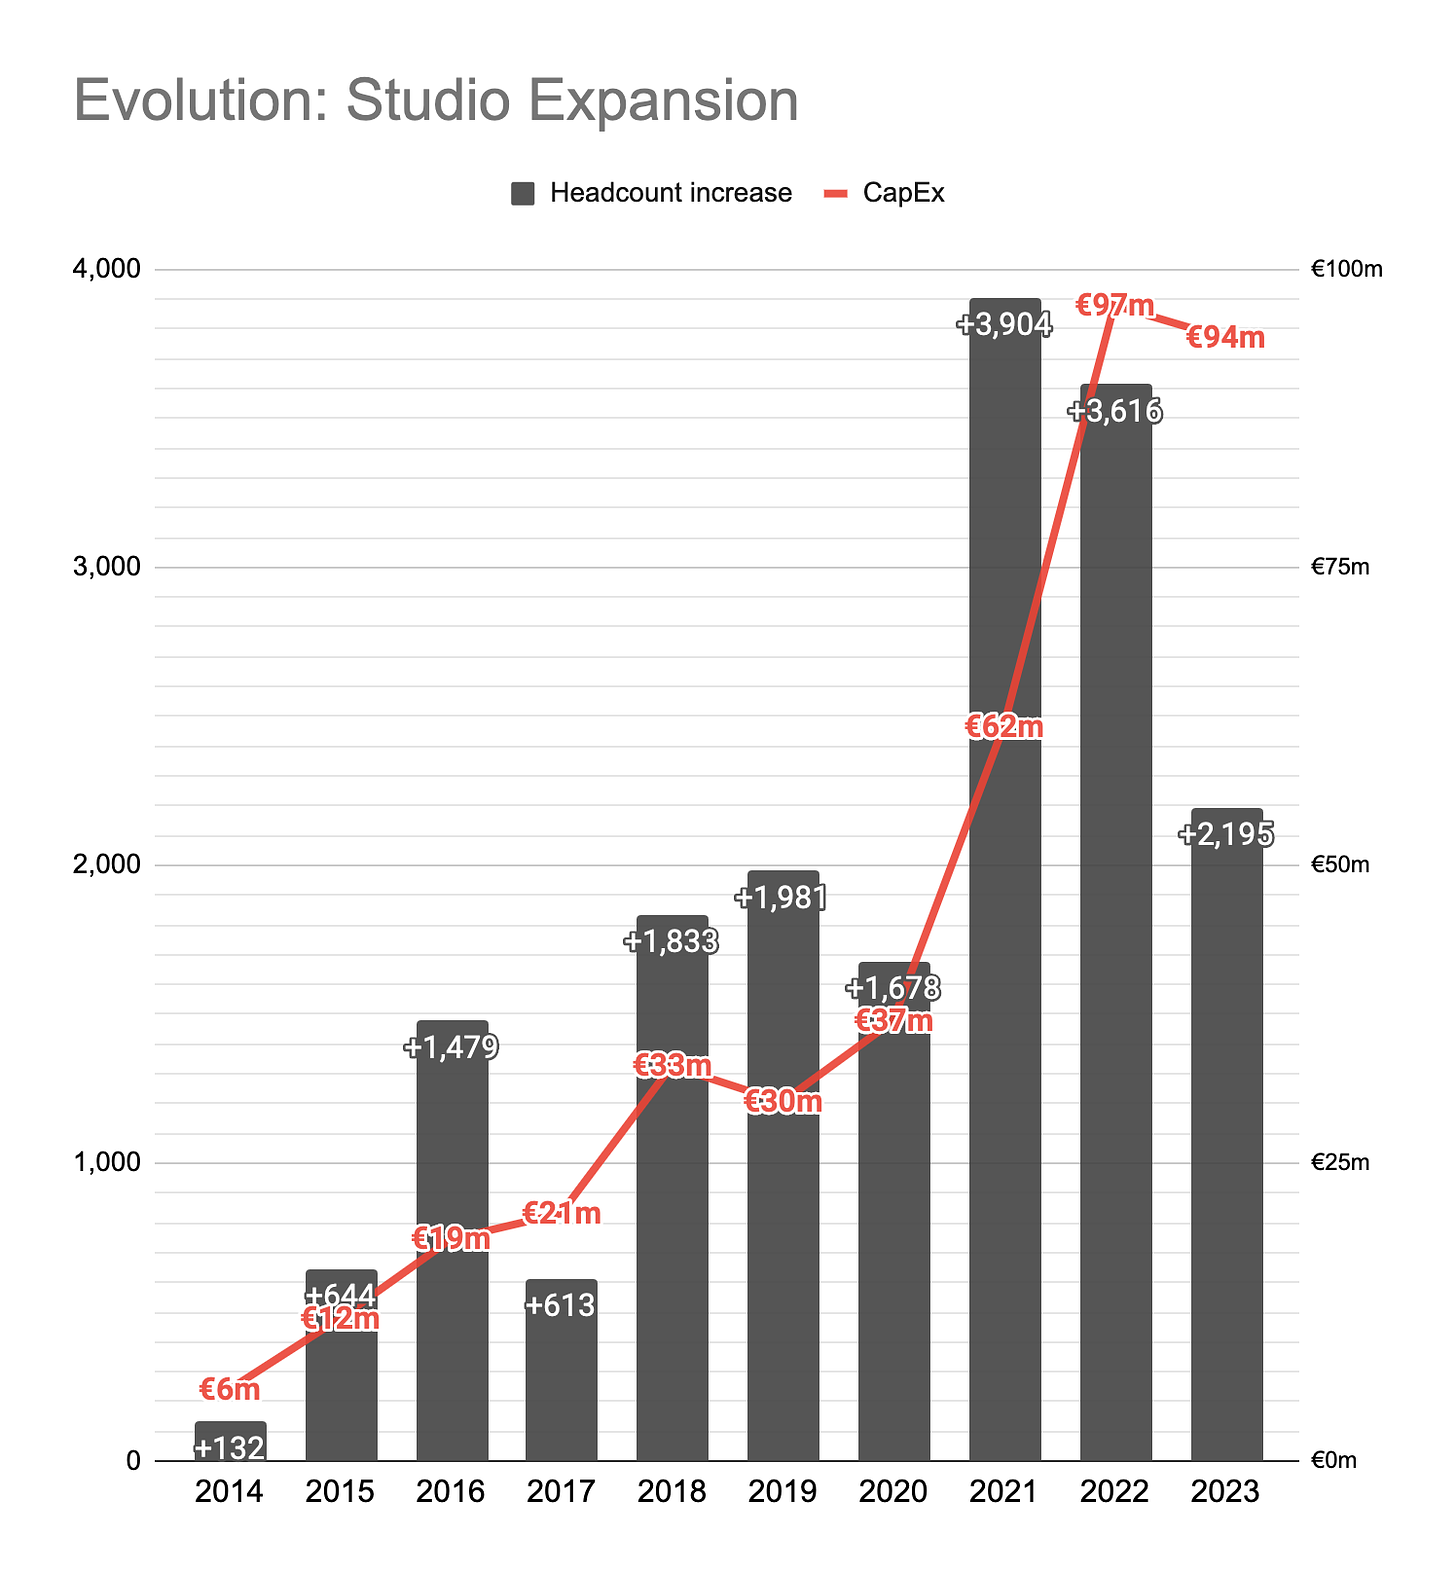
One of Evolution’s most important tools to defend its growth rates is expanding its studio capacity, so that the company can better serve the ever growing Live Casino demand globally and, if required, locally.
Despite a last-quarter sprint in recruitment, 2023 was a relatively slow year for Evolution’s expansion efforts compared to previous two years.
Since Evolution’s studio investments have a relatively quick turnaround period, we can also very roughly measure how much sales growth these investments generate in a year.
After a post-COVID bump, the revenue generating effects of the CapEx spend seems to have come down to pre-COVID levels. Even at these lower levels, every Euro of CapEx is creating over 3 Euros of new Live Casino revenue (with nearly 60% profit and FCF margins) the following year.
In yet another sign that the completed studio investments have been effective and not made for appearances’ sake, Evolution’s average table generated over €1,000,000 in annual sales for the second year in a row. Moreover, assuming average margins, the average table created €587,000 of annual FCF compared to €526,000 last year.
Growth Sources
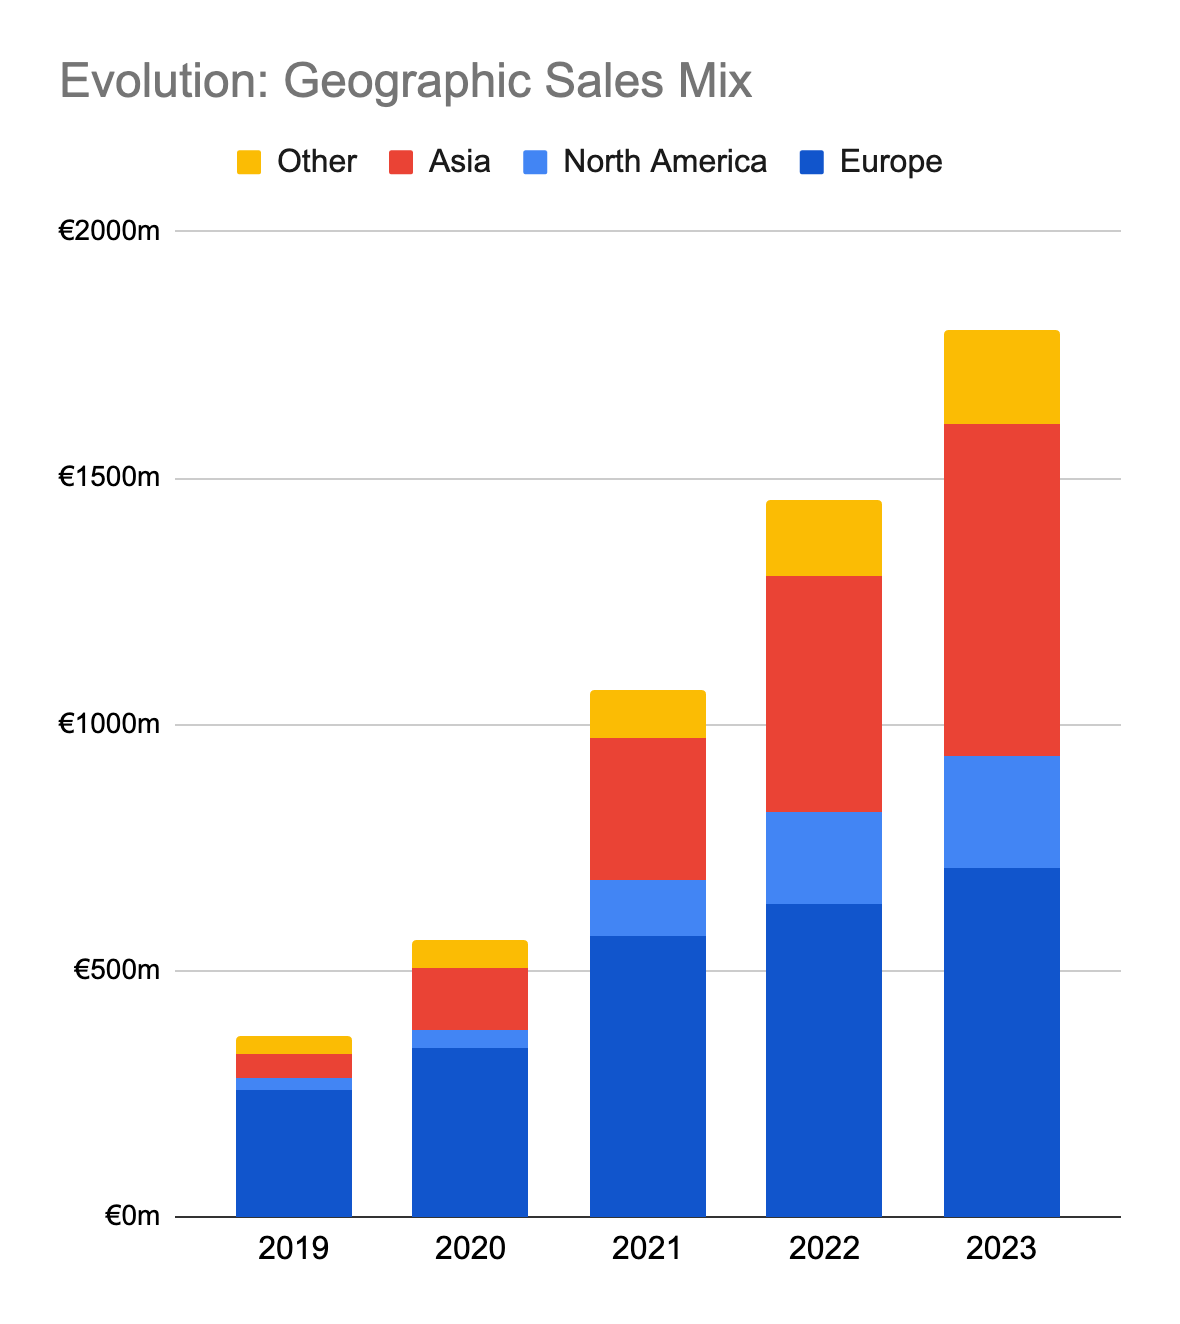
Europe and Asia were Evolution’s largest markets and generated over 3/4ths of the company’s annual sales in 2023.
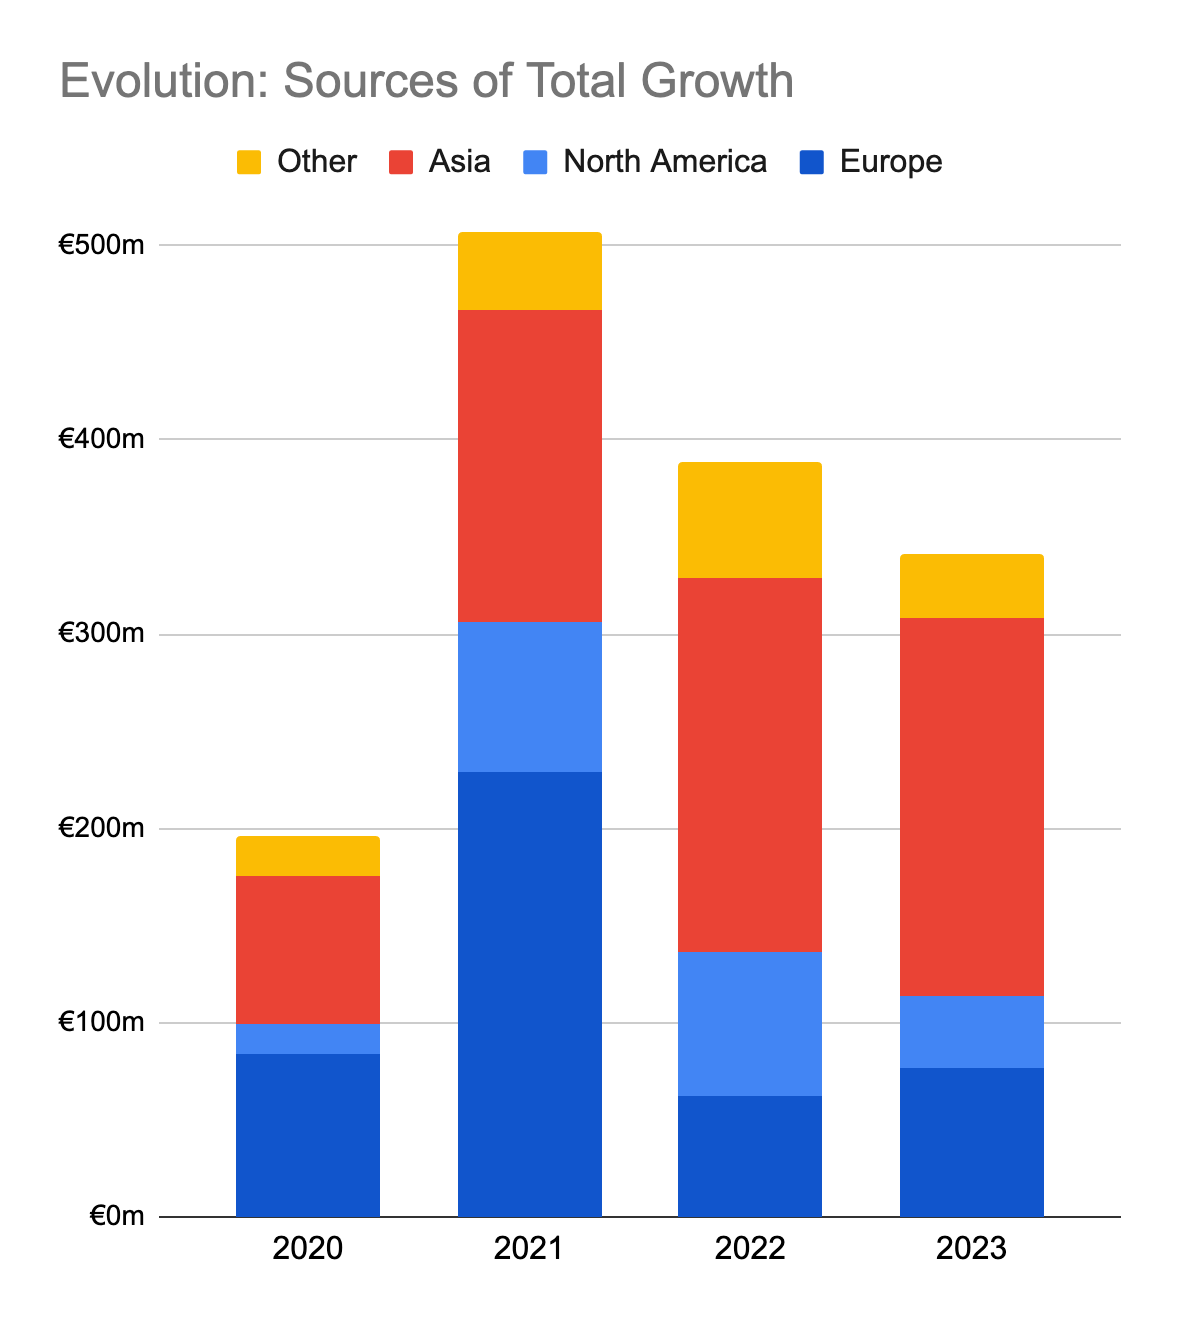
Looking at total growth gives the impression that Evolution’s nominal growth is decline.
However, as mentioned before, these figures include significant portions of inorganic growth in 2021 and 2022 from RNG acquisitions.
If we clear the growth amounts from the acquired and non-growing RNG segment, we can estimate the organic growth that Evolution generated each year.
As can be seen above, Evolution’s nominal organic growth has been remarkably consistent in the last 3 years. Also, in those 3 years, Asia provided half of Evolution’s organic growth.
We can further zoom in on the 2023 growth to compare regional growth to that in regulated and unregulated sources.
One worrying piece of information in Evolution’s year end disclosures was the jump in the company’s dependency on its top-5 customers.
Notably, Evolution classifies B2B aggregators as single customers. Since aggregators mainly resell Evolution’s games to multiple operators, actual operator-level customer concentration may not be as dire as it looks. Still, there are many theories regarding the composition of the top customers due to the opaqueness of company’s disclosures in this matter.
RNG
Q4 results confirmed my suspicion that Evolution wasn’t paying the full earn-out amounts for its past acquisitions acquisitions RNG studios, namely Big Time Gaming and Nolimit City.
As confirmed with Investor Relations, Evolution put some performance targets in the purchase agreement of BTG and NLC in order to merit the subsequent earn-out payments. The disappointing RNG performance seems to have caused the following reductions in 2023 earn-out payments:
EUR 67.6 million paid to BTG instead of the maximum 115 million for the year
No earn-out paid to NLC instead of the maximum EUR 50 million for the year
Interestingly, at the time of the acquisitions, the goodwill was calculated with the assumption that these earn-outs would be paid in full at their assigned years. Time will tell if this €97.4 million reduction in earn-outs will affect that goodwill.
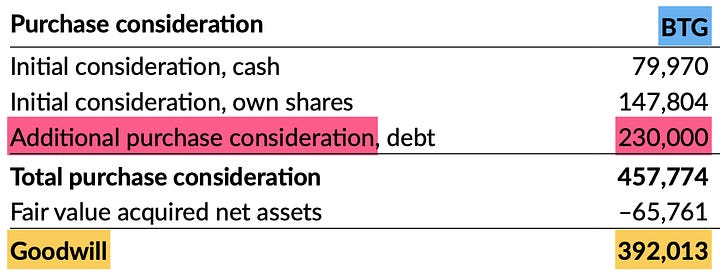

As a further thought experiment, let’s assume that Evolution’s RNG segment continues its stagnation for the next few years and the BTG and NLC earn-out payments are reduced to the same degree as in 2023.
In such a case, BTG’s acquisition price would drop from €450 million to €355.2 million and NLC’s price would drop from €340 million to €200 million. Taking their results from the acquisition years, this would reduce BTG’s purchase multiple to 21 P/E and NLC’s to 16 P/E (or roughly 10 EV/EBITDA for both companies).
Although far from perfect, performance-based earn-out reductions could make the past acquisitions just a bit easier to swallow for shareholders in case of continued RNG stagnation.
Cash Allocation
Of the operational cash flow generated in 2023, Evolution invested 12% in CapEx and acquisitions (i.e. earn-out) and is returning over 82% to shareholders in the form of dividends and buybacks.
It’s not difficult to foresee that Evolution will have at least €400-500 million of surplus cash in 2024 and face a similar choice between possible acquisitions and buybacks, as it did in 2023.
Disclaimer: This is not investment advice. Please read the full disclaimer in the About page.







Nice write up.. Had a question regarding the graph where you show the studio expansion, dont you think the 2021 increase in headcount could be due to the acquisitions that EVO made?
Thank you for the write-up!