Evolution's 2022: Year in Review
I hope that you enjoyed my review of Evolution’s Q4 2022 quarterly results. In this second part, I will rundown a few of the company’s multi-year trends. In case you haven’t already noticed, I am a visual learner.
So, let’s start with my favorite chart of any public company.
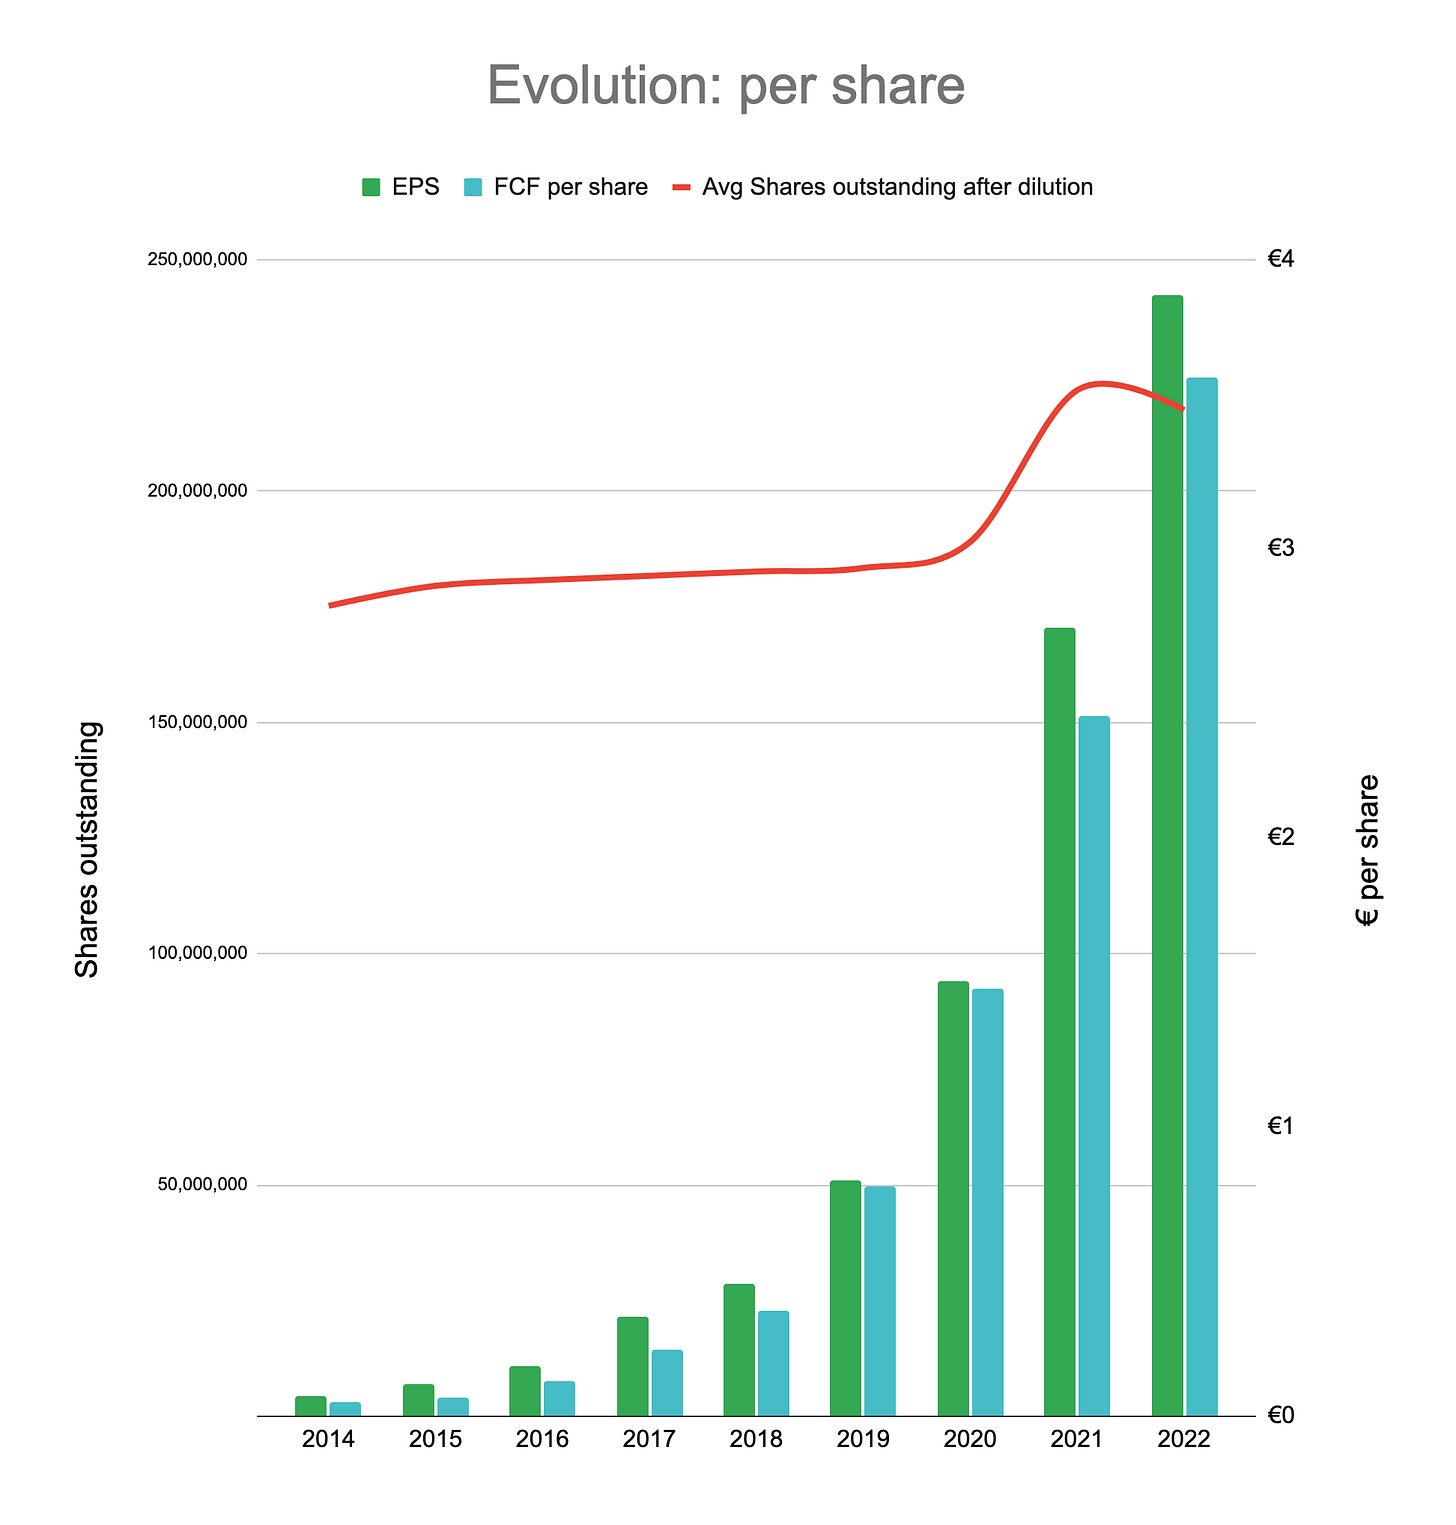
In the last 8 years, Evolution’s sales have grown 30x while its profits have grown 70x.
In the same time period, EPS has grown 56x and FCF per share has grown 76x.
The almost 17% increase in the number of shares from 2020 to 2021 is due to the all-stock NetEnt merger. This as well as the later acquisitions are important to keep in mind when measuring Evolution’s recent growth.
At first glance, Evolution annual revenue growth rate seems to swing wildly from 50% to 90% and then crash back to below 40% lately. However, this doesn’t completely represent the operational reality of the business.
As mentioned in the Q4 quarterly review, Evolution’s Live and RNG segments have completely different performance profiles.
Live Casino is Evolution’s core competency with a growing moat model. Aside from the relatively small Ezugi acquisition in 2018, the Live segment grows completely organically.
Considering RNG barely grows organically, Live revenue can be roughly taken to measure Evolution’s organic growth.
As previously mentioned, CapEx spent by Evolution to support its organic growth has a quick turnaround period. As a simplistic showcase, comparing each year’s CapEx to next year’s Live revenue growth shows (very, very roughly) how wonderful Evolution’s Live Casino business is.
For the last 3 years, every euro of CapEx has created over 5 euros of new Live Casino revenue (with over 50% profit margins) the following year.
Another wonderful aspect of Evolution’s Live Casino is the efficiency and, thus, the operating leverage of its innovative studios.
Evolution consistently generates more sales from each of its tables, where the incremental revenue comes close to pure profit. By the end of 2022, company’s average table seems to have achieved the momentum to generate €1,000,000 in annual sales.
Zooming out back to the combined Live + RNG segments, it is not hard to see that Evolution’s acquisitive foray into RNG has yet to return an additional growth worth the around 3 billion euros of dilutions and cash commitments.
“When a management with a reputation for brilliance tackles a business with a reputation for bad economics, it is the reputation of the business that remains intact.” —Buffett
While at it, let’s also mention a couple of further bearish points.
Evolution and its shareholders have greatly benefited from the extraordinarily low tax rates that have been available to businesses that could channel online service revenues through desired jurisdictions.
However, as CFO Jacob Kaplan has also confirmed, this state of affairs is fast coming to a end. Starting from 2024, Evolution’s tax rates will likely double. This will put a permanent dampening effect on the profit margin as well as all kinds of returns compared to those up to today.
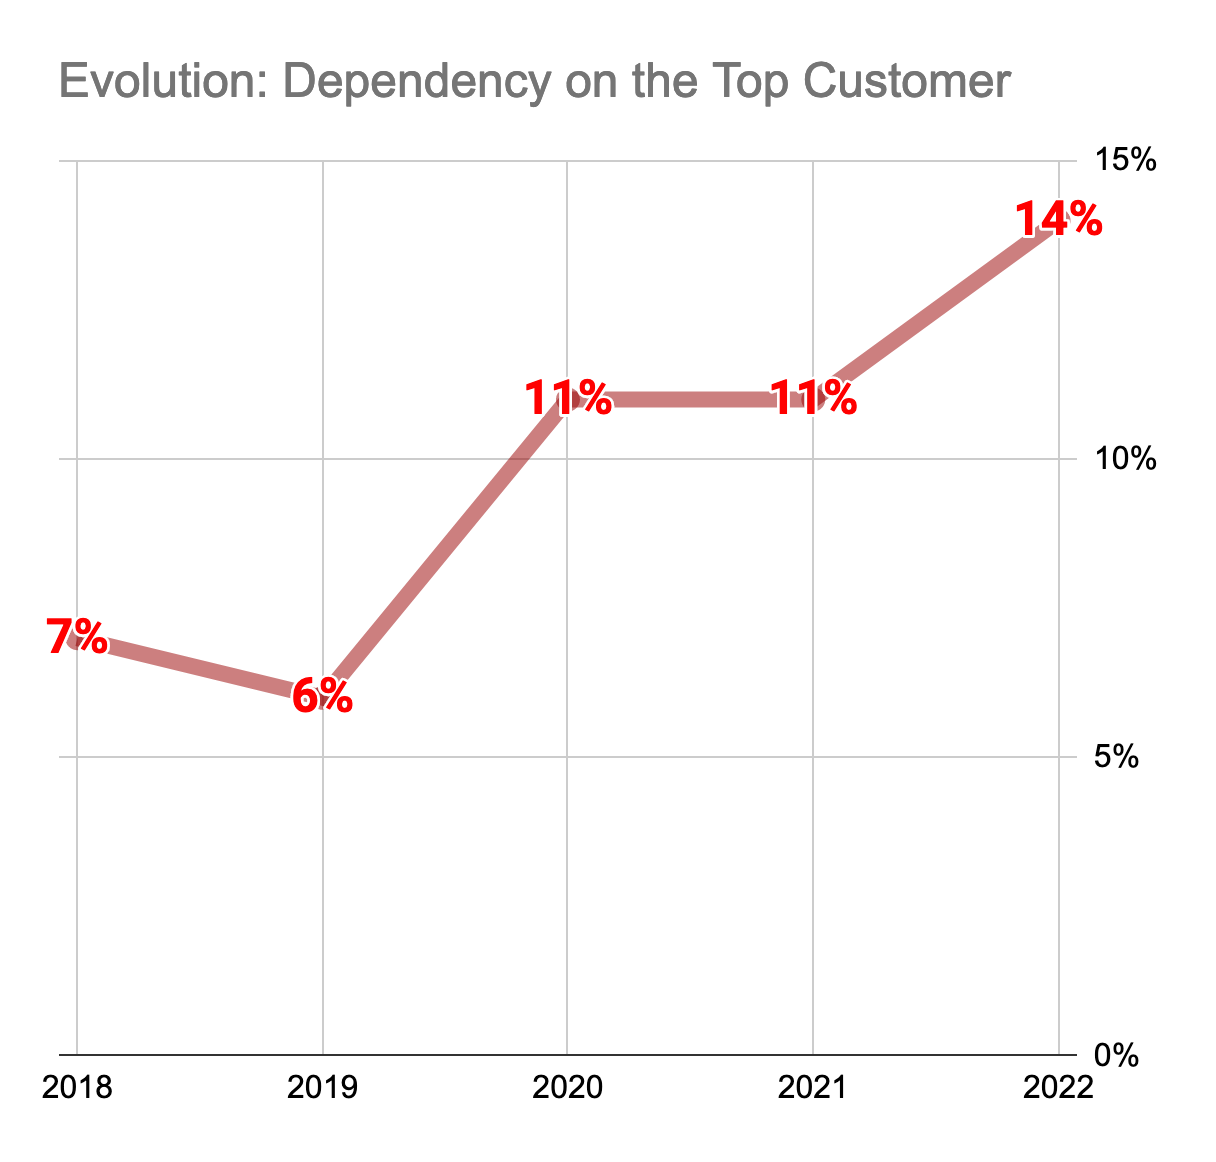
The second point involves increasing customer concentration.
In the last 4 years, Evolution’s dependency on its top customer has doubled to 14%. This means that one in every seven euros in sales in 2022 were to a single customer. That’s over €200m in the year, to give a sense of the scale.
Admittedly, I excluded prior years from this comparison on purpose. The company had a similar dependency back in 2015 and before. However, today’s Evolution is more advanced compared to then in its scale and market reach. This makes today’s dependency even more salient.
What can we guess?
Sources of organic growth
The geographic breakdown of the last 4 years’ annual revenues is below.
Using these, we can conclude from where the growth was sourced for the last 3 years.
However, these growth figures include significant amounts of acquired growth. Estimating solely organic sources of growth requires finding the acquisitions’ inorganic growth contribution to each year. Thankfully, the biggest contributor by far is NetEnt for which we can use last publicly available filings to arrive at an informed guess. As before, acquired RNG developers’ slow growth is helpful in this endeavor.
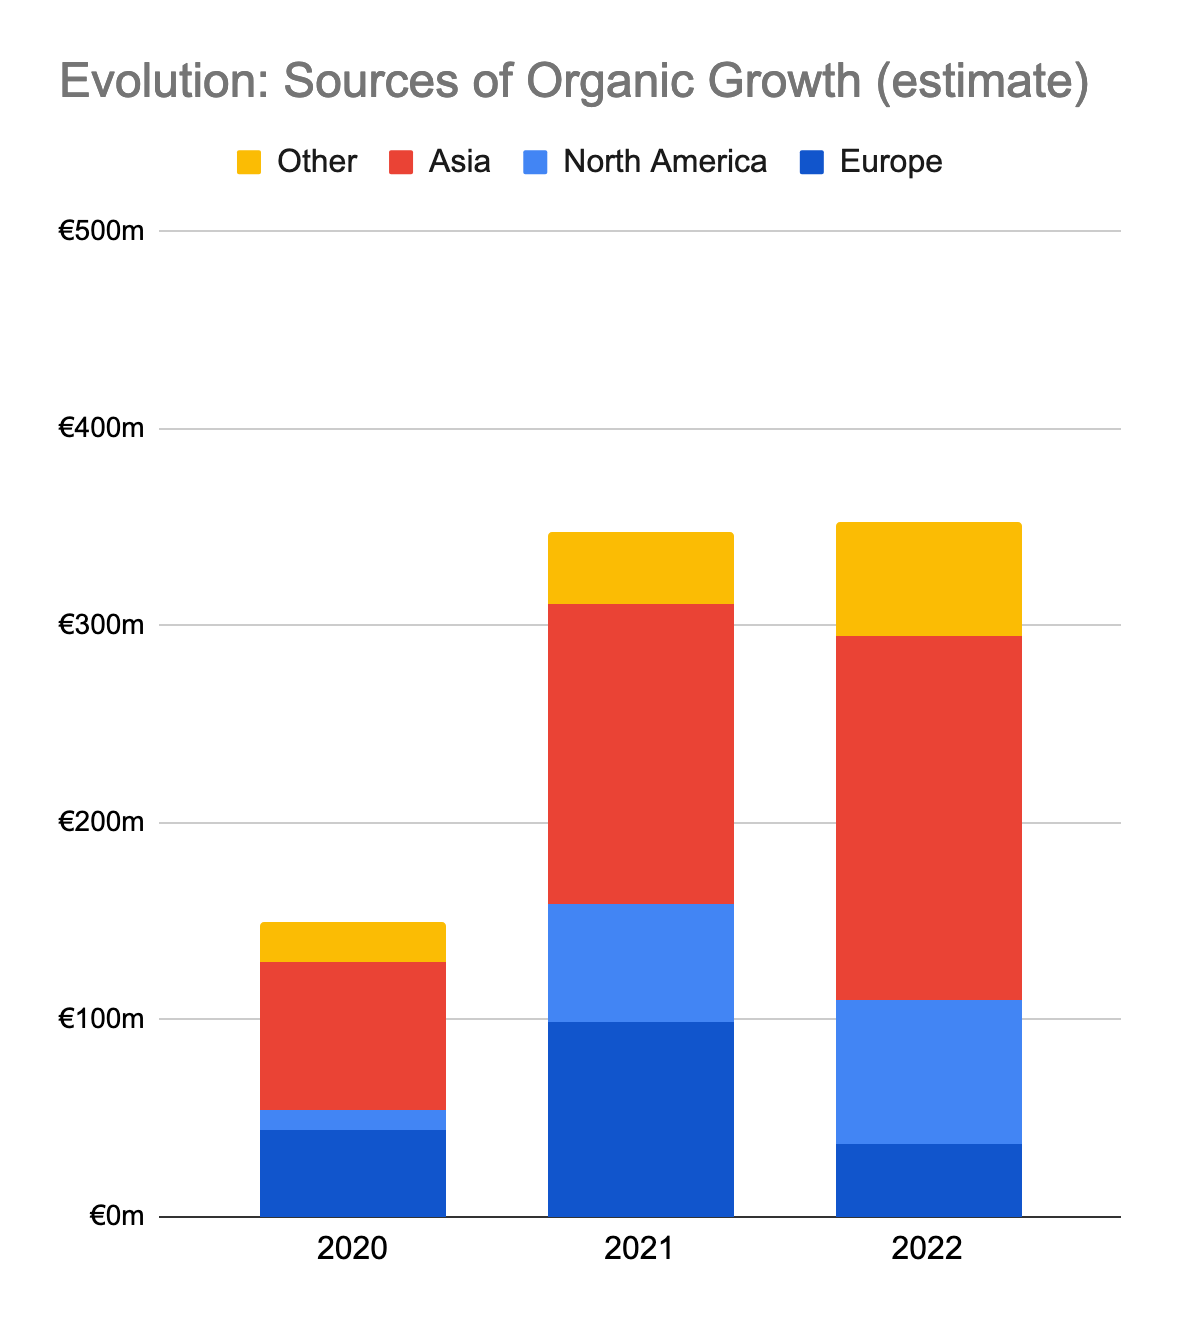
With a bunch of questionable assumptions, I land at the following estimates for the organic growth composition of the last 3 years.
What is most striking in this graph compared to the previous one is how much of the organic growth seems to depend on Asia. If roughly correct, Asia constitutes almost half of Evolution’s all organic growth from the last 3 years. Previously, I have also estimated that Asia is already Evolution’s largest Live Casino market. Simply put, Asia is Evolution’s most significant yet least disclosed market.
Management’s Play Money
Assuming that the board keeps the dividend payout policy as nonnegotiable (despite CEO Martin Carlesund’s objections) still leaves a significant amount of cash for further capital allocation at management’s discretion.
Both buybacks and further acquisitions (up to double of the available cash via future earn-out commitments) could be possible scenarios for the coming year.
Next: You can find my takeaways from Evolution’s 2022 Annual Report here.
Disclaimer: This is not investment advice. Please read the full disclaimer in the About page.


Great read as always! Something to add which you may have noted already is the heavy insider buying thats happening especially by Todd.. Always great to see management buy signals...
Always impressed with your work!